You are here: Running the Model > Run-Time Menus & Controls > Debug Option > Debugging ProModel Logic
The Debugger is a convenient and efficient way to test or follow the processing of any logic defined in your model. The debugger is used to step through logic one statement at a time and examine variables and attributes while a model is running.
Before discussing the details of the Debug option, it is important to understand the following terms:
Statement A statement causes ProModel to take some action or perform some operation. This includes statements such as GET, JOIN, and SPLIT AS. (See Statements and Functions for more information).
Logic Logic refers to the complete set of statements defined for a particular process record, downtime event, initialization logic, or termination logic for a simulation.
Thread A thread is a specific execution of any logic. A thread is initiated whenever a logic needs to be executed. This can be an entity running through an operation logic, the initialization logic, a resource running a node logic, a downtime logic, or any other logic. Note that the same logic may be running in several threads at the same time. For example, three entities of the same type being processed simultaneously at the same multi-capacity location would constitute three threads.
A thread or logic execution can be suspended by any statement, causing simulation time to pass (e.g., GET Res1, WAIT 5, etc.). After such a statement completes its task, the thread is resumed. During the time a thread is suspended, other threads may be initiated, suspended, resumed, or completed. This is called thread switching.
Please note
Even though several threads can execute the same logic at the same time in the simulation, the simulation processor can only process them one at a time. So there is really only one current thread while all other threads are suspended (either scheduled for some future simulation time, or waiting to be executed after the current thread at the same simulation instant).
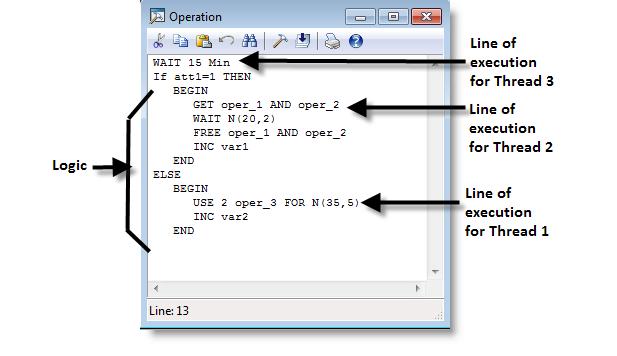
To better explain the above concepts, consider the following operation logic for a multi-capacity location.
The logic includes all statements shown on previous page. Let’s assume that there are three different entities currently executing this operation logic. Each executing entity constitutes a thread. A possible scenario for this case is the following: Thread 1 is an entity using two units of resource Oper_3 for N(35,5) minutes. Thread 2 is an entity waiting for resource Oper_1 to become available. The last thread is a different entity which has completed 10 minutes of the 15 minute wait executed at the beginning of the logic. Note that two entities arriving at a multi-capacity location at nearly the same time could both execute the same WAIT or USE time in the logic, only in different threads.
In general, for a logic block containing statements that pass simulation time, any number of threads can wait for the required simulation time to elapse, corresponding to each time elapsing statement. These threads are scheduled to resume at some future simulation time.
There can also be many threads (any number of threads corresponding to each of the time elapsing statements within the logic) which have completed their waiting time, but await their turn to continue execution. These threads are on hold because the simulation engine is busy with another thread scheduled for the same simulation time. There is only one thread executed at any real time instant by the simulation engine.
The debugger window will display a unique identification number for the current, active thread. This thread ID number will help you differentiate between different instances of the same logic block while you are debugging your models.